 Click on the image at left for printer-friendly version…
By David R. Hines, CFA, Director of Research
Recent indications that the Federal Reserve Bank has plans to “taper” its quantitative easing program in the coming twelve months has given bond investors good reason to bid interest rates meaningfully higher.
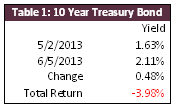
The graph below illustrates the rise in the yield of a 10-year Treasury note since May 2. Income-producing securities have experienced a sharp downward correction in value as a direct result of the rise in interest rates.
As readers of these notes know, we have been wary about portfolio exposures to securities that would be affected by an upward move in interest rates, such as long maturity bonds and high yield equities (especially those dividend paying stocks with poor dividend coverage and poor growth prospects). In the current interest rate environment we have expressed concerns that even a small upward move in interest rates could cause large negative price movements in the value of such securities[1]. In our view today’s low income yields present far more downside risk than return potential.
The price movement of the 10-year Treasury note since May 2 illustrates how bond pricing works and makes our point. An investor who purchased this Treasury note at the beginning of May would have paid a price which resulted in a 1.63% yield-to-maturity. This means the investor could look forward to earning 1.63% annually over the life of the note. However, because the yield on this Treasury note rose 0.48% since he purchased it, the investor suffered nearly a 4% loss in the principal value of this security. Or, to put the loss in a slightly different perspective, this investor lost two years of annual return in a little over one month!
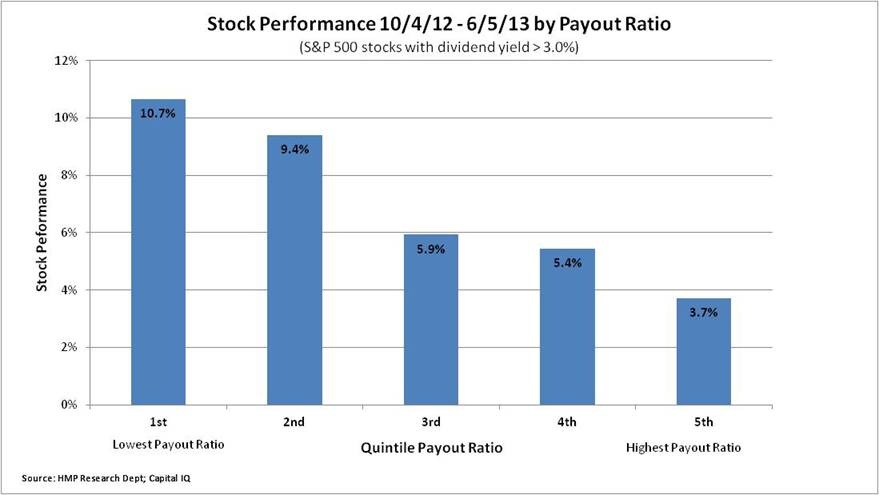
Our concerns regarding rising interest rates have not been limited to bonds with long maturities. We have suggested that there may exist an unsustainable ‘yield bubble’ in certain segments of the equity market. We observed in our October 2012 Research Note, “Not All Dividends Are Created Equal”, stocks with the highest yield commanded the richest valuations. We noted that “small increments of higher dividend yield beget much more additional risk than return”. We recommended clients seeking current income be discriminating and look to high yielding stocks with well-supported dividends which, on average, were selling at discounted valuations.
In light of the rise in yields, generally, we looked at how these high-yield equities fared since we published our cautionary note. As before, we divided a list of well-capitalized U.S. stocks with dividends greater than 3% into five quintiles, based on their payout ratios (the percentage of their earnings they distribute to shareholders as a dividend). We then compared the performance of each of these five groups of stocks since our previous letter. As the graph below illustrates, the quintile of stocks with the lowest dividend payout ratio (i.e., those stocks with the best dividend coverage) significantly outperformed the quintile of stocks with the poorest dividend coverage.
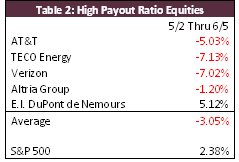
 Most of the underperformance in the high yield stocks with poor dividend coverage took place after interest rates began their recent ascent. Table 2 lists five representative stocks from the fifth quintile which we had highlighted at the end of last year and opined were extremely overpriced and particularly vulnerable to an increase in interest rates. Certainly their recent, sharp price declines underscore our assertion that stocks valued primarily for their dividend yield were every bit as vulnerable in a rising interest rate environment as longer maturity fixed income securities, if not even more at risk. Despite their poor relative performance over the last several months, we continue to avoid longer dated bonds and stocks with poor dividend coverage and/or poor prospects of future dividend growth, trading at above-average dividend yields.
Market Log- June 18, 2013
S&P 500: 1651.81
10 year T-Note: 2.19%
Crude Oil: $97.88
Gold: $1366.00
If you have questions or comments regarding this or any other communication from us, please email us at hmpresearch@hmpayson.com.
This commentary is prepared by HM Payson for informational purposes only and is not intended as an offer or solicitation for the purchase or sale of any security. The information contained herein is neither investment advice nor a legal opinion. The views expressed are those of the author as of the date of publication of this report, and are subject to change at any time due to changes in market or economic conditions. The comments should not be construed as a recommendation of individual holdings or market sectors, but as an illustration of broader themes. HM Payson cannot assure that the type of investments discussed herein will outperform any other investment strategy in the future, nor can it guarantee that such investments will present the best or an attractive risk-adjusted investment in the future. Although information has been obtained from and is based upon sources HM Payson believes to be reliable, we do not guarantee its accuracy. There are no assurances that any predicted results will actually occur. Past performance is no guarantee of future results. Registration with the SEC or with any state securities authority does not imply a certain level of skill or training.
All Content © 2013 HM Payson
[1] The mathematical term for this is convexity. When interest rates are low, small changes in rates cause large changes in price.
In the face of elevated stock market volatility, rising US-China trade tensions,…
Maine Huts & Trails provides outdoor excursions in beautiful Western Maine, boasting…