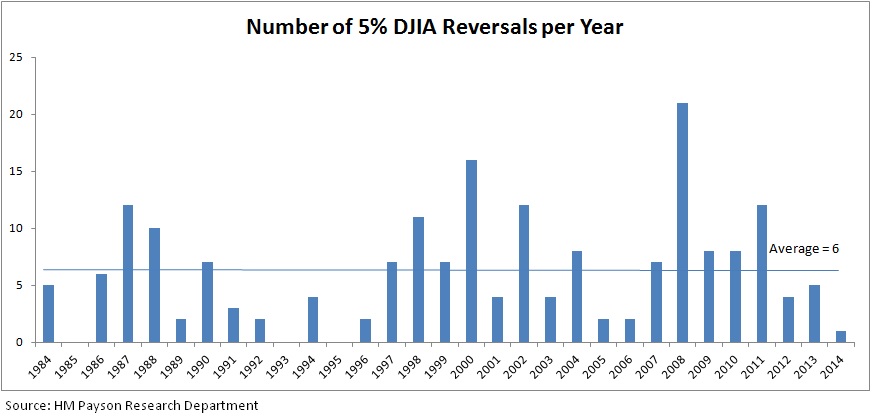
Historically speaking, the lack of volatility over the last several years has indeed been abnormal. The graph below illustrates this point. It looks over the last 30 years at the number of 5% reversals the market experienced in each year. In this graph a reversal is defined as the market dropping 5% or more over consecutive negative days. In fact, we have experienced only one of these events in 2014. The market has averaged 6 such reversals annually over the past 30 years. As a comparison, in 2008 the market had 21 of these 5%+ reversals!
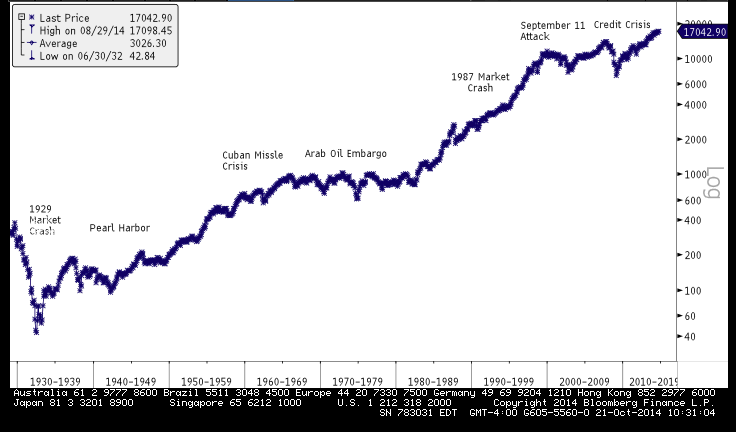
There are several possible explanations for the recent increase in market volatility. Data suggests global economic growth is slowing; Europe appears to be falling back into recession. And, geopolitically, the unnerving rise of ISIS and the frightening spread of the Ebola virus into the US have engendered fear and uncertainty – which markets dislike. The graph below looks at volatility over a longer time horizon. Going all the way back to 1928, we overlay the DJIA with some significant historical events. This graph is a good reminder that there has always been volatility; but over time the price trends upwards.
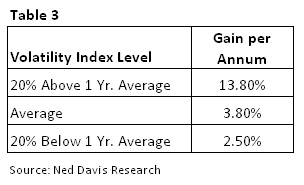
Long-term oriented investors can use volatility to benefit their returns. Table 3 illustrates returns for different levels of the Volatility Index.[1] Forward market returns are much higher when the volatility index is high. The average annual gain for the market is almost 14% when this index is 20% above its one year average. Volatility creates opportunity!
In the very short run, stock price movements account for virtually all of the market’s return. Growing profits and dividends explain a larger and larger part of the market’s return as the holding period moves away from the short run. For more than a year we have been concerned about high valuations and the low Volatility Index. Even though recent downward market price volatility has delivered improved valuations, our expected returns for most asset classes remain low, both absolutely and relative to long-term historical average returns. Our research process focuses on finding businesses capable of generating and compounding cash flows. We buy the stocks of these businesses at prices we believe will give us an opportunity to earn reasonable returns. Short-term volatility often provides us the opportunity to build positions in companies with strong fundamentals and reasonable valuations.
Market Log- October 20, 2014
S&P 500: 1,941.28
10 year T-Note: 2.22%
Crude Oil: $82.76
Gold: $1,246.80
This information is for educational purposes only and is not intended as tax advice. Please consult your tax advisor for information that is more detailed or for advice regarding your individual situation. This commentary is prepared by H.M. Payson for informational purposes only and is not intended as an offer or solicitation for the purchase or sale of any security. The information contained herein is neither investment advice nor a legal opinion. The views expressed are those of H.M. Payson as of the date of publication of this report, and are subject to change at any time due to changes in market or economic conditions. The comments should not be construed as a recommendation of individual holdings or market sectors, but as an illustration of broader themes. H.M. Payson cannot assure that the type of investments discussed herein will outperform any other investment strategy in the future, nor can it guarantee that such investments will present the best or an attractive risk-adjusted investment in the future. Although information has been obtained from and is based upon sources H.M. Payson believes to be reliable, we do not guarantee its accuracy. There are no assurances that any predicted results will actually occur. Past performance is no guarantee of future results. Registration with the SEC or with any state securities authority does not imply a certain level of skill or training. All Content © 2014 HM Payson
[1] The Volatility Index or VIX it is a mathematical measure of how much the market thinks the S&P 100 Index option, or OEX, will fluctuate over the next 12 months, based upon an analysis of the difference between current OEX put and call option prices.
In the face of elevated stock market volatility, rising US-China trade tensions,…
Maine Huts & Trails provides outdoor excursions in beautiful Western Maine, boasting…